The story of a real data quality bug, how it got caught, and what it means for data engineering.
Twenty-six years ago, in my first real programming job, I was cleaning medical records using Perl so a handful of researchers could run statistical analyses over them. Slow, manual, thoroughly tedious work. Every field needed coaxing, every row carried its own small history of data entry error. I think about those months every time I write a parser now. The AI tools that exist today would have saved me weeks. The tedium itself hasn’t gone anywhere, and it still takes human judgment to finish the job. What has changed is how much ground one engineer can cover before the judgment calls start. Additive, not replacing.
From there, I wrote clinical applications, the kind that track patients through the medical system. Admissions, transfers, discharges, the whole choreography of a patient moving through care. After that came medical logistics, tracking supplies and devices across health systems and reconciling what got charged against what got used. Same lesson, three different angles on it. Healthcare data is messy in ways that matter, and the people stuck cleaning up the mess are almost never the ones creating it.
I’ve kept an eye on the space ever since. So when CMS’s Hospital Price Transparency Rule took effect on January 1, 2021, I was already paying attention. This article isn’t about the data or analysis, although that was interesting; it’s more about the fact that you can now analyze this data without needing a small team in the way you used to by using LLMs to aid in data cleaning.
How we got the data in the first place
A short detour on the law, because the files I’m about to describe did not appear by accident. Section 2718(e) of the Public Health Service Act, added by the ACA in 2010, told every hospital to “make public” its standard charges. That sentence sat more or less inert for nine years. In June 2019, Executive Order 13877 directed HHS to write a rule with real requirements. The final rule, codified at 45 CFR Part 180, took effect January 1, 2021. It required every hospital to publish a machine-readable file containing gross charges, discounted cash prices, payer-specific negotiated rates, and de-identified minimum and maximum negotiated rates for every item and service.
A year later, the companion push hit insurers. The No Surprises Act, enacted as part of the Consolidated Appropriations Act of 2021, dealt primarily with surprise billing protections, but its sibling regulation, the Transparency in Coverage final rule, required group health plans and insurers to post their own machine-readable files of in-network rates and out-of-network allowed amounts starting July 1, 2022. In November 2023, CMS standardized the hospital template, tightened enforcement, and required hospitals to affirm their files were “true, accurate, and complete.” Then, in December 2025, Executive Order 14221 and a follow-on CMS proposal went further, directing insurers to disclose estimated dollar amounts where they had been getting by with opaque percentage formulas.
That is the legal scaffolding. The practical reality is that 7,200 hospitals complied, each doing it in its own way. Some published JSON. Some published CSV. Some published XLSX spreadsheets. Some published ZIPs containing any or all of the above. Some published what looked like compliant files but were HTML error pages with a .json extension. Two generations of the official CMS schema coexist in the wild. Most hospitals ignore both.
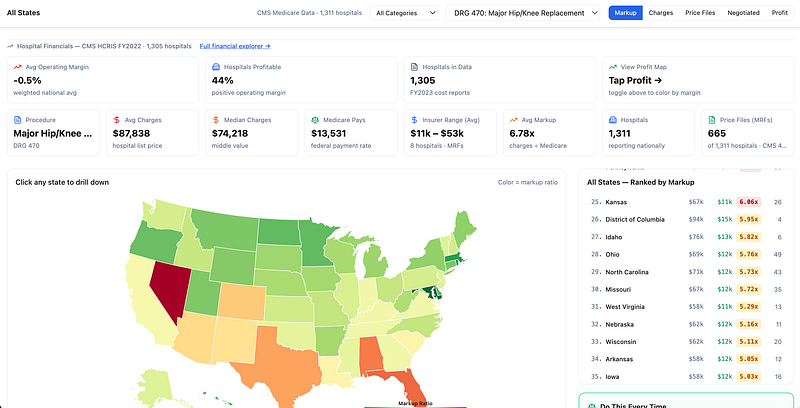
This is the raw material of a medical data exploration app I’ve been building. It is also the setting for a lesson about what AI actually changes in data engineering, and not the glamorous part.
The pipeline
Any tool built on this data needs a pipeline. Mine pulls from five federal sources.
- CMS IPPS data. Medicare benchmark rates for roughly 1,300 hospitals across 84 DRGs. A 36MB CSV with cryptic column names.
- Hospital machine-readable files. The negotiated rates I just described. 7,200 hospitals, zero format consistency.
- CMS Hospital Cost Reports (HCRIS). Annual financial filings covering operating margins, charity care ratios, and ownership type for 5,700 hospitals. Submitted on Form 2552–10, an artifact of an earlier century, with 110 columns and line items named things like G3–1.
- CMS Medical Loss Ratio data. ACA compliance data showing whether insurers spent 80 to 85 percent of premiums on actual care.
- Geographic crosswalks. ZIP-to-metro mappings for aggregating anything by market. You’ll have to get this data from USPS or another source.
The hard part was the machine-readable standard price files (MRFs). To handle seven distinct formats, I wrote a dispatcher. Try JSON first. Inspect the structure to pick which of the four JSON variants applies. Fall back to CSV. Detect whether the CSV is payer-per-row or a matrix layout. Handle XLSX. Handle XML. Unzip archives and recurse. Close to a thousand lines of parsing logic, built with AI assistance, that successfully extracted rate data from 72 hospitals before I stopped pulling new files and started looking at what I had.
That’s where things stood when I decided to run a quality audit on what I had pulled in so far.
The audit
The audit script checks eleven things across all data sources. Structural impossibilities. Statistical outliers. Cross-source inconsistencies. The sort of questions an engineer who has been burned a few times learns to ask.
One check was conceptually simple. A payer’s negotiated rate should never exceed the hospital’s gross charge. The gross charge is the chargemaster rate, the sticker price, the highest number in the system. Every negotiated rate sits below it, by definition.
The audit found 1,373 violations of this rule.
First instinct was that 1,373 errors means the audit itself is wrong, or the threshold is too loose, or the data is noisier than I think. I looked at the distribution.
All 1,373 findings came from exactly seven hospitals.
Noise does not cluster like that. Seven hospitals showing the same symptom across dozens of procedure codes means a systematic cause. A loose thread worth pulling.
The bug
Six of the seven hospitals turned out to be in Arkansas, all using XLSX matrix files. The seventh was in Arizona, on a CSV payer-per-row format.
The Arkansas files had all been parsed by the same code path, _parse_xlsx_matrix. Their spreadsheets had a column the parser identified as the gross charge. It matched the detection heuristic, "average charge," and so the parser grabbed it as gross_charge.
“Average charge” in a hospital XLSX is ambiguous. It can mean the chargemaster rate. It can also mean the average allowed amount, the average of what was actually paid across all payers for that procedure code in that year. For these six hospitals, the column held that average, a number that varies with what payers agreed to, nothing like a ceiling.
When some payers negotiated rates above that average, which they routinely do, those rows appeared to violate the invariant. Hence, 1,373 false positives. Except they were not really false positives. They were flagging a genuine parser error in the gross charge column.
The Arizona hospital was its own thing. One of its DRGs showed a gross charge of $23.36. The payer rates for the same code ranged from $1,167 to $1,541. A $23.36 gross charge for an inpatient procedure is a per-diem or per-unit figure grabbed from the wrong column, not a chargemaster rate.
Two bugs in the end, one systematic and one specific. Neither had surfaced until the audit caught them.
The fix
The fix for both cases came down to the same logic, applied differently. If any payer rate exceeds the gross charge by more than 5 percent for a given DRG, that gross charge value is not a chargemaster rate. Null it out for that DRG rather than show a misleading number.
For the XLSX files the fix worked per-DRG, a surgical nullification of only the rows that violated the invariant, leaving the correct values elsewhere in the same file intact. For the Arizona CSV the $23.36 also fell to a separate rule: gross charges below $50 are almost certainly not chargemaster rates for inpatient procedures.
After patching the seven files and updating the parser for future runs, I reran the audit.
Zero mrf_rate_exceeds_gross_charge findings.
The fix took the high-severity audit count for that category from 1,272 down to zero. 1,373 specific data errors corrected across seven files.
What AI actually did
Worth being precise about where AI sat in this story, because the popular framing tends to overreach. The bug turned up in the audit, a deterministic Python script with eleven checks and no AI involved at runtime. AI helped me write that script. That is a different thing from finding the bug, and the difference matters.
What AI changed was how much of the pipeline got built, and how deep the quality checks went.
Writing the parser. The seven-format MRF dispatcher, close to a thousand lines of format-specific logic, came together with AI helping me draft each parser, reason about edge cases, and design the dispatch. The prompt I kept coming back to, adapted for each new format, looked like this:
I have N files from different hospitals that all claim
to be the same format. Here are the first 50 lines of
each, separated by "---":
[file 1 content]
---
[file 2 content]
For each file, tell me:
1. The structural pattern (columns or keys, nesting, repetition).
2. Which fields appear to contain gross charge, negotiated
rate, payer name, and procedure code. Flag anything ambiguous.
3. What varies between files that my parser will need to handle.
4. What I am likely missing by looking at only 50 lines.
Do not write parsing code yet. I want the structural
analysis first.
The last instruction matters more than it looks. The mistake I made early on was letting the model jump straight to code. Once a model commits to a parsing approach, it starts rationalizing around its own first guess, and by the time you notice the mistake, you have already built five functions on top of it. Asking for structural analysis first, code after, kept the reasoning honest and saved me from shipping a parser that would have silently mishandled the matrix XLSX files even worse than it did.
Decoding government schemas. The HCRIS cost report PUF has 110 columns with names like G3–1 that reference line items in a CMS paper form. Feeding the form documentation to an AI cut hours of cross-referencing down to minutes. The prompt:
Here are the 110 column headers from Form 2552-10:
[paste headers]
Here is the CMS documentation for this form:
[paste relevant excerpt]
Map each column I need to its semantic meaning.
I am specifically looking for:
- Operating margin (or the inputs to calculate it)
- Charity care expenditure
- Ownership type
- Total discharges
For each mapping, cite the part of the documentation
that supports it. If you are unsure, say so rather
than guessing.
“Cite the part of the documentation that supports it” is the instruction doing the real work. Without it, a model will pattern-match plausibly named columns and you end up with data that looks correct and is not. I once had a model confidently map a column called OP_MARGIN to operating margin when the documentation made clear it was an inpatient-only subset. Requiring citations forced the model to either produce a real source for its mapping or admit it could not find one, both of which beat a wrong answer delivered with confidence.
Building the audit. The audit script was not in the original plan. I added it because the data quality questions, are these rates plausible and are there cross-source inconsistencies, are exactly the questions an experienced data engineer learns to ask. The prompt that actually generated the check list looked like this:
I am building a data quality audit for a healthcare
pricing dataset. Each row represents a payer-specific
negotiated rate for a specific procedure at a specific
hospital.
Given this schema:
- hospital_id
- drg_code
- payer_name
- gross_charge
- negotiated_rate
- discounted_cash_price
- min_rate
- max_rate
List the invariants that should hold in this data.
For each one, tell me:
1. The invariant in plain English.
2. Why it should hold (what real-world fact forces it).
3. How I would detect a violation.
4. What the most likely cause of a violation would be.
Rank them by how useful they would be for catching
parser bugs vs real data errors.
That last ranking question is what surfaced the check that caught the 1,373 bug. Asking “what would cause a violation” forces the model to generate a diagnostic hypothesis, not just a check, and separating parser bugs from real data errors put the gross-charge invariant near the top. A parser confusing average charge with chargemaster rate was exactly the kind of bug that invariant was designed to expose. I wasn’t looking for that specific bug when I wrote the audit, only for parser bugs as a class, and the prompt gave me the right net to catch them with.
One thread runs through all three prompts. Most data quality checks never get written because the cost-benefit doesn’t pencil out during initial development, and in enterprise settings that becomes a long-running tax on trust in your data. AI lowers the cost enough to change the calculus. The audit that found 1,373 errors exists because writing it was cheap, and the reason the right checks ended up in it is that I asked the right questions at the outset.
What is still open
Not every audit finding becomes a fix. Some become documentation. Some go on a watch list.
5,257 discharge counts at the CMS suppression floor. CMS suppresses discharge counts below 11 and reports them as exactly 11 to protect patient privacy. These show up in the data, but they are not real counts. They mean “fewer than 11.” This is documented CMS policy. The right response is to note it.
711 extreme DRG markup ratios. Hospitals are submitting charges more than 20 times the Medicare payment rate for specific procedures. The highest is a New Jersey hospital charging $325,217 for a procedure where Medicare pays $8,227. A 39.5× markup. The number is almost certainly accurate, since hospitals set their own chargemaster rates without a regulatory ceiling. Surfacing that gap is what a price transparency tool is for.
1,021 statistical outlier MRF rates. Negotiated rates more than 3.5 standard deviations from the mean for their procedure code across all parsed hospitals. Any of them could be legitimate specialty pricing, an unusual contractual arrangement, or a data entry error. Sorting out which is which takes domain judgment, and an automated audit can flag but cannot resolve.
That is the honest picture of a data quality process. Some findings turn into fixes, others turn into documentation, and a handful stay on a watch list. AI helps run the loop faster. The human judgment calls at the end do not go away.
Is this the future of data engineering?
The honest answer, for a specific and important class of problems, is yes.
The category where AI changes the economics most is the one where the bottleneck is engaging with complexity. Understanding an undocumented government schema. Handling seven file formats from 7,200 sources with no standardization. Writing the quality checks that should exist, but usually get cut because there is no time.
These problems are not unsolvable without AI. They are expensive. They require specialist knowledge, careful reading of documentation, and a willingness to iterate through edge cases. None of that goes away. AI just lowers the cost, speeds up the iteration, and raises the floor on what a small team can take on.
The 1,373 data errors silently propagating through this pipeline are not a unique pathology. They exist in every large-scale data integration project involving heterogeneous government sources. Most of the time they go unfound because writing a comprehensive audit is its own project, and there is always something more urgent.
Framing this as “AI cleans data” misses the point. I wrote the audit because writing it was cheap. Verifying the fixes took an afternoon, because rerunning the audit took seconds. Documenting what was found, fixed, and still open fit in the same day. The whole loop stayed cheap enough to close. The tooling is less interesting than the fact that any of this exists as a one-person project.
Healthcare pricing data has always been opaque. The federal transparency mandates have produced a vast, unruly, inconsistent dataset that is technically public and practically inaccessible without real engineering effort. What has changed is who can afford to do that engineering, and the answer is increasingly a much smaller team than you would think.
Twenty-six years on from cleaning medical records by hand in Perl, a single engineer can take a project like this remarkably far. The work still has to happen. The human judgment still has to run at the end. What changed is how much of it one person can actually finish in a day.
By Joshua McDonald on April 23, 2026.
Reader discussion